Asia Cement (China) Holdings Corp (HKSE:0743) (12 June 2025)
Asia Cement (China) Holdings Corporation has navigated a severe cement industry downturn from 2020 to 2024, defined by structural overcapacity, a sharp decline in the real estate sector, and intense price wars within the Chinese cement market. The company's financial performance has consistently deteriorated, with revenues and profits declining annually, culminating in a net loss of RMB 262.6 million in 2024. The Group's primary defense against these overwhelming market pressures has been its financial prudence, maintaining a strong and conservative balance sheet with a low gearing ratio of 14% and substantial cash reserves of RMB 8.88 billion as of 2024, which provides a critical buffer for stability.
INDUSTRY OVERVIEW in 2024
1. Supply and Demand Dynamics
The Chinese cement industry in 2024 was defined by a significant imbalance between shrinking demand and persistent overcapacity.
Demand Contraction: Demand experienced a sharp and continuous decline, primarily driven by a severe downturn in the real estate sector. Key indicators from 2024 highlight the extent of this slump:
Real Estate Development Investment: Plummeted by 10.6%.
Floor Space of Newly Started Housing: Dropped by a staggering 23.0%.
National Cement Output: Fell by approximately 9.5% year-on-year to around 1.83 billion tons.
While government-led infrastructure investment grew by 4.4%, this was insufficient to compensate for the profound weakness in the property market. The impact was evident in the sales figures of major producers like Anhui Conch and West China Cement, which reported year-on-year sales volume decreases of 7.46% and 8.7%, respectively.
Supply Landscape: Despite falling demand, the industry's structural issue of overcapacity worsened in relative terms.
Capacity Changes: While 52 older production lines were eliminated, resulting in a net decrease of 23.52 million tons of clinker capacity, new capacity was still added (between 10.4 to 14.7 million tons). Total clinker capacity stood at approximately 1.76 billion tons by year-end.
Industry Response: Faced with collapsing profitability, particularly in the first three quarters, the industry intensified self-discipline measures in the fourth quarter. These included "anti-involution" (anti-cutthroat competition) efforts and more normalized "peak-shifting production" (coordinated production stoppages) to stabilize falling prices.
This dynamic of demand destruction far outpacing supply-side correction led to intense price competition and a severe drop in industry profits, which were estimated to be down by approximately 20% for the full year.
2. Capacity Utilization and Regulatory Impacts
The supply-demand imbalance directly suppressed production rates, while a wave of new government policies is set to reshape the industry's operational and competitive landscape.
Capacity Utilization Trends: Capacity utilization rates remained at low and declining levels, severely eroding profitability. Data from West China Cement illustrates this trend clearly:
Shaanxi Province: Utilization fell to ~61% (from 65% in 2023).
Xinjiang Province: Utilization dropped to ~50% (from 56% in 2023).
Guizhou Province: Utilization saw a significant decline to ~44% (from 58% in 2023).
These low rates, particularly in regions like Guizhou, indicate that many facilities are operating at economically unsustainable levels, creating strong pressure for market consolidation and the exit of less efficient players.
Key Regulatory Impacts: The government introduced stringent policies in 2024 aimed at driving sustainability and rationalizing capacity.
Environmental Mandates: A major policy push requires the industry to meet ultra-low emission standards by 2028 and achieve specific energy-saving and carbon-reduction targets by the end of 2025. Critically, the cement sector is being integrated into the national carbon trading market (ETS), with 2024 as the first regulatory year. This will monetize carbon emissions, increasing operational costs for less efficient plants and incentivizing investment in green technology.
Capacity Management: New capacity replacement rules have been tightened, most notably by prohibiting cross-province capacity relocation in key oversupplied regions. This policy aims to force the genuine retirement of outdated facilities rather than simply shifting the overcapacity problem elsewhere.
Production Safety: An ongoing focus on enhancing mine safety is driving investment in automation and "intelligent mining" systems, which can also yield operational efficiencies.
Together, these regulations will significantly increase capital and operational costs, acting as a powerful catalyst for industry consolidation by accelerating the exit of older, non-compliant, and financially weaker enterprises.
3. Product Demand Forecast for 2025
The outlook for cement demand in 2025 remains cautious, with market stability heavily dependent on the fragile balance between infrastructure support and continued real estate weakness.
Sectoral Projections:
Real Estate: The property market is expected to remain in an adjustment phase, with cement demand from this sector continuing its downward trend. However, government support measures, such as financing for affordable housing projects, may help to narrow the rate of decline.
Infrastructure: Investment in infrastructure is anticipated to be the primary driver of cement demand in 2025, backed by significant fiscal stimulus, including the issuance of ultra-long-term special government bonds. However, industry leaders express caution, noting that local government debt pressures and potential inefficiencies in project execution could limit the ultimate impact on cement consumption.
Market and Corporate Outlook: Reflecting this cautious sentiment, leading companies are not projecting a rebound. Both Anhui Conch Cement and Asia Cement (China) have stated that they expect their 2025 sales volumes to be similar to 2024 levels. This flat forecast suggests a consensus that growth in infrastructure will, at best, only offset further declines from real estate, establishing a "new normal" of structurally lower demand.
Market stability in 2025 will be highly contingent on the sustainability of industry self-discipline. While coordinated production halts helped stabilize prices in late 2024, there is a significant risk that these cooperative arrangements could fracture if demand proves weaker than expected, potentially triggering renewed price wars.
(1) Historical performance
The stock performance of Asia Cement (China) Holdings Corporation has been on a consistent downward trend since early 2020, a movement that closely mirrors the company's deteriorating business performance characterized by declining revenues, shrinking profitability, and a challenging operating environment. The provided analysis, covering 2020 to 2024, details the internal and external pressures that have directly contributed to the company's financial decline and, consequently, its poor performance on the stock market.
The company's stock, which traded at significantly higher levels in early 2020, has seen a substantial erosion in value through to 2024. This decline aligns with a grim financial trajectory detailed in the performance analysis.
Year-by-Year Financial Decline:
2020:
Revenue decreased by 14% year-on-year to RMB 10.82 billion.
Net profit fell by a similar margin. The company started the period with a net profit of RMB 2.75 billion.
2021:
Revenue saw a brief recovery, increasing by 8.6%.
Despite revenue growth, net profit fell sharply by 33.8% due to soaring coal prices.
This disconnects between revenue and profit highlighted a key vulnerability.
2022:
The situation worsened significantly.
Revenue dropped by 18.2%.
Net profit experienced a catastrophic plunge of 76.7%.
2023:
Revenue decreased by another 22.7%.
Net profit plummeted by a further 73.8%.
2024:
The company's struggles culminated in a net loss of RMB 262.6 million.
This marked a stark reversal from the RMB 2.75 billion net profit recorded in 2020, encapsulating the severe headwinds faced by the company over the five-year period.
The root causes for this decline, as outlined in the analysis, are multi-faceted and have been consistently communicated to the market, influencing investor sentiment:
Persistent Demand Weakness: A major factor has been the sharp downturn in China's real estate sector, a critical end-market for cement, which has been explicitly mentioned in the company's reports for 2023 and 2024. Slowdowns in infrastructure projects have further dampened demand.
Severe Overcapacity and Price Wars: The Chinese cement industry is plagued by structural overcapacity, leading to intense and "cutthroat" price competition, described as "involution". This has severely eroded pricing power and margins, with the 2024 report noting that product price reductions outpaced cost savings from cheaper raw materials.
Volatile Input Costs: While coal prices decreased in 2023 and 2024, the dramatic surge in 2021 and 2022 crippled profitability and demonstrated the company's high sensitivity to input cost fluctuations.
Management's Optimistic Forecasts vs. Reality: The annual report analysis points to a recurring pattern of management outlooks being overly optimistic, particularly concerning market recovery and profitability, which ultimately did not materialize. This discrepancy between forecasts and actual results likely impacted investor confidence over time.
Despite these challenges, the company has maintained a strong balance sheet with a low gearing ratio, which decreased from 24% in 2020 to 14% in 2024, and substantial cash reserves. The company has also been making strategic investments in green transformation and digitalization. However, these long-term initiatives have yet to offset the immediate and severe market pressures.
In conclusion, the sustained downtrend in Asia Cement (China)'s stock price from 2020 to 2024 is a direct reflection of its declining business fundamentals. The erosion of revenue, the collapse of profit margins, and the eventual slide into a net loss, all driven by a deeply troubled industry environment, have provided a clear and compelling narrative for investors that has been mirrored in the stock's valuation. While the company's financial prudence and strategic investments offer a glimmer of long-term potential, the market has, for the past five years, priced the stock based on the challenging and unprofitable reality of its present operations.
Product segment analysis
Core Products: Cement and Clinker
The primary business of Asia Cement (China) is the production and sale of cement and clinker, which form the core of its revenue base. This segment has faced significant headwinds due to a market characterized by weak demand, oversupply, and intense price competition.
Sales Volume: The sales volume for cement and clinker has seen a general decline over the five-year period. After selling 28.84 million tonnes in 2020, volume rose slightly to 29.50 million tonnes in 2021 before falling to 27.72 million tonnes in 2022 and 26.09 million tonnes in 2023. Sales volume continued to decrease in 2024. This downward trend highlights the severe contraction in the company's core market.
Pricing: The company has struggled to maintain pricing power. The average selling price per tonne of cement was RMB 346 in 2020, rose to RMB 379 in 2021, but then fell sharply to RMB 324 in 2022. Prices continued to decrease significantly in 2023 and 2024, with the company noting that price reductions outpaced cost savings.
Specialty Cement: To differentiate its offerings, the company developed special cement products in 2020, such as low-heat and acid/alkali-resistant cement.

Average Selling Price
First, let's look at the average selling price (ASP) per tonne for each product. This helps us understand the value of each product. As you can see from the table below, the ASP for all products has been decreasing over the last few years.

The Numbers: Price vs. Volume Decline (2019-2024)
The percentage change for both the average selling price (ASP) and the sales volume of cement between the earliest and latest years in data:

The price per tonne of cement has fallen by 40.5%, while the sales volume has decreased by a smaller, though still substantial, 24.8%. This indicates that the company had to slash prices aggressively to maintain its sales volume in a challenging market.
(2) Current trend and how to profit from
1. Rise of "Anti-Involution" and Industry Self-Discipline
The management has noted a potential shift away from the destructive price wars that have plagued the industry.
Favorable Trend: In late 2024, there were efforts within the Chinese cement industry to counter the cycle of "low-price, cutthroat competition" through industry self-discipline and a renewed focus on profit improvement. Management noted that this "coopetition in the industry" provided some hope for better market conditions in 2025.
Potential Benefit: A more disciplined market could lead to more stable and rational cement pricing. This would allow Asia Cement (China) to improve its profitability and retain the benefits from any cost reductions, rather than passing them on through lower selling prices in a bid for market share.
2. Green Transformation and Stringent Environmental Regulations
While regulations impose costs, management views the company's proactive investments in green technology as a long-term competitive advantage.
Favorable Trend: China's continued push towards "dual carbon" goals and stricter "ultra-low emission" standards will increase pressure on all cement producers. Asia Cement (China) has consistently invested in green and low-carbon development, achieving national recognition for its "Green Factory" and "Green Mine" statuses.
Potential Benefit: By being ahead of the curve in green technology, the company positions itself to have a significant competitive advantage as regulations tighten. This could result in lower long-term compliance costs, preferential treatment from authorities, or the ability to continue operating while less advanced competitors are forced to halt production or exit the market entirely.
3. Potential for Industry Consolidation
The challenging market environment is expected to drive consolidation, creating opportunities for financially sound companies.
Favorable Trend: The severe downturn and persistent overcapacity are likely to force smaller, less efficient, or financially unstable competitors to falter.
Potential Benefit: With its strong balance sheet, very low gearing ratio (14% in 2024), and substantial cash reserves (RMB 8.88 billion in 2024), Asia Cement (China) is well-positioned to weather the downturn. This financial strength could allow the company to pursue opportunistic consolidation by acquiring assets or market share from failing competitors at favorable terms. The investment in a joint venture in 2024 may be an early sign of this strategy.
4. Easing of Raw Material Costs
Management noted the decreasing cost of key inputs like coal, which presents an opportunity for margin improvement.
Favorable Trend: The prices of major raw materials, including coal, decreased year-on-year in 2023 and 2024. The industry outlook for 2025 also suggested that coal prices might continue to decline.
Potential Benefit: Lower coal costs directly reduce the company's cost of sales, which can ease pressure on gross margins. This trend offers a direct path to improved profitability, though the company's ability to benefit is contingent on cement selling prices stabilizing and not falling faster than the cost reductions.
(3) Financial performance

(a) Balance Sheet Quality
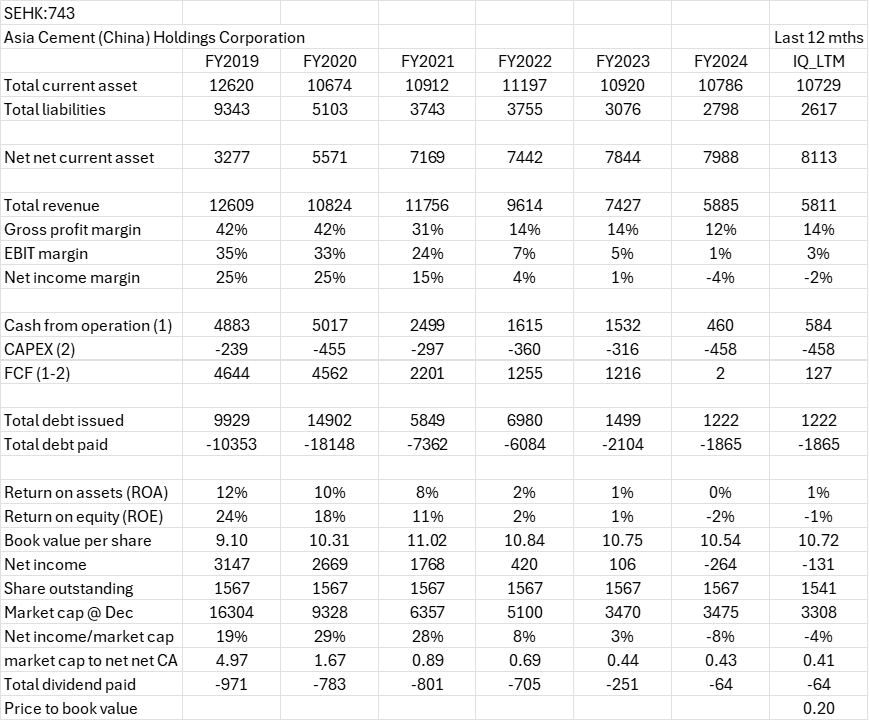
The quality of the company's balance sheet is arguably its most significant strength, acting as a crucial buffer against severe operational headwinds. Your observation that the Net-Net Current Asset (NNCA) position has been positive and improving since 2018 is a key indicator of this strength. This improvement is not driven by a surge in current assets, which have remained relatively stable, but by a deliberate and successful campaign of deleveraging. Total liabilities have been reduced dramatically from over ¥9.3 billion in 2019 to just under ¥2.8 billion by 2024. This has transformed the balance sheet from a net liability position to one holding a substantial cushion of liquid assets, providing significant financial flexibility.
High volume of yearly debt refinancing is spotted, where annual debt issued and repaid is multiples of the cash from operations. While this indicates high activity, the net effect has been overwhelmingly positive. The company is not taking on more debt; rather, it appears to be actively managing its debt profile while systematically paying it down. The gearing ratio (total liabilities to total assets) corroborates this, falling from 24% in 2020 to a very conservative 14% in 2024, showcasing prudent capital management.
Furthermore, the book value per share has remained remarkably resilient, staying above ¥10.50 even after the company swung to a net loss in 2024. However, the slight decline from its peak in 2021 is a warning sign that continued losses will begin to eat into this foundation more aggressively.
In essence, the company has forged a fortress-like balance sheet. This financial prudence provides the "staying power" needed to survive a protracted industry downturn and continue investing in long-term strategic projects when more leveraged competitors might falter.
(b) Earnings and Cash Flow Analysis
The earnings and cash flow picture presents a stark contrast to the balance sheet's strength. Revenue and profit margins have been on a steep downtrend since their peak in 2020. A combination of sustained weakness in the real estate and infrastructure sectors, chronic industry overcapacity, and destructive price wars described as "involution". The company's profitability is highly sensitive to these pressures. The fall in gross margin from 42% in 2020 to just 10-12% in 2024, culminating in a net loss, demonstrates that the company has been unable to pass on costs in the hyper-competitive market. This high operating leverage creates a "whipsaw effect," where even moderate revenue declines lead to magnified collapses in net income.
On the cash flow front, the business has consistently generated free cash flow (FCF) and has historically been a sign of operational efficiency. The company reliably converted profits into cash, which was sufficient to fund capital expenditures (CAPEX) while also paying down debt and distributing dividends. However, this trend has deteriorated alarmingly. Cash from operations plummeted from over ¥1.5 billion in 2023 to just ¥460 million in 2024, causing the FCF for that year to collapse to a mere ¥2 million. This is a critical red flag, signalling that the operational weaknesses are now severely impacting cash generation.
The company's capital allocation strategy appears to be a mix of shareholder returns and strategic reinvestment. CAPEX has remained consistent, directed towards crucial long-term initiatives like green transformation and diversification into aggregates, which are seen as essential for future viability. Simultaneously, dividend payments have been drastically cut, reflecting the new reality of diminished earnings and cash flow. The company is in a race against time: it is using its strong balance sheet to fund a strategic pivot while its core earnings engine is failing. The ability to reverse the negative trends in margins and cash flow will be the ultimate determinant of its long-term success.
(c) Other income impact on reported net income

2019 & 2020: Minor Positive Contribution
2019: The net gain from other activities was RMB 219.7 million, contributing 7% to the final robust profit of RMB 3.23 billion. This was a minor, positive supplement to very strong core business earnings, driven primarily by stable interest income and government grants.
2020: Similarly, a net gain of RMB 251.3 million represented 9% of the RMB 2.75 billion profit. This small boost was supported by strong interest income (RMB 176.5 million), significant government grants (RMB 84.6 million), and a one-off gain on the disposal of right-of-use assets (RMB 13.1 million).
In these years, the company's core operations were highly profitable, and other income served as a minor enhancement to the bottom line.
2021: Significant Negative Impact
2021: This year marked a dramatic shift. A net loss from other activities of -RMB 170.6 million negatively impacted the final profit of ¥1.82 billion by -9%. The primary driver was a massive RMB 226.4 million loss from penalties and related surcharges. This, combined with an impairment loss on an investment (RMB 53.3 million) and a loss on idle land (RMB 27.3 million), completely overwhelmed the otherwise steady other income streams. This was the first year where non-operational items became a major drag on declining profits.
2022: A Critical Cushion to Falling Profits
2022: As core profitability collapsed, other income became critically important. The net gain of RMB 183.0 million accounted for a substantial 43% of the final profit of RMB 424.0 million. With no major one-off losses and continued strong interest income (RMB 159.1 million), this net gain provided a crucial cushion, preventing the company's profit from being nearly halved.
2023: Masking an Operational Loss
2023: The materiality of other income reached an extraordinary 178%. The net gain of RMB 197.6 million was significantly larger than the reported profit of ¥111.2 million. This indicates that the company's core business operations (pre-other income) were actually running at a loss of approximately RMB 86.4 million. The positive reported profit was entirely attributable to non-operational activities, primarily driven by strong interest income (RMB 189.2 million) and a new, material gain on fair value changes on financial assets (RMB 21.6 million).
2024: Mitigating a Deeper Loss
2024: The company reported a net loss of -RMB 262.6 million. The net gain from other activities was RMB 156.3 million, which had a materiality of -60%. This means the positive contribution from other income significantly reduced the year's total loss. Without this net gain, the final loss would have been 60% larger, at approximately -RMB418.9 million. The gain was driven by continued high interest income (RMB 189.1 million), a large gain on fair value changes of financial assets (RMB51.8 million), and a new income stream from solid waste treatment (RMB 18.8 million). However, these gains were partially offset by renewed penalties from authorities (RMB 38.3 million) and a significant share of losses from associates (RMB 51.0 million).
Summary of Impact
The role of "other income" has evolved dramatically. In the profitable years of 2019 and 2020, it was a minor bonus. In 2021, significant one-off penalties turned it into a major liability. From 2022 onwards, as core operational earnings deteriorated, net gains from other activities became a lifeline. In 2023, they single-handedly kept the company profitable, and in 2024, they prevented a much deeper reported loss. This shows a growing and critical reliance on non-operational items—specifically interest from large cash balances and financial asset gains—to support a bottom line that is under severe pressure from the core cement business.
(d) Implications of deferred tax asset and liabilities

Highest Risk Item
Allowance of ECL of trade and other receivables
This Deferred Tax Asset (DTA) is the most likely candidate for earnings manipulation.
Trend Analysis:
From 2019 to 2021, the allowance grew from RMB 44M to RMB 81M. This made sense as the business was large.
However, from 2022 to 2024, the allowance decreased from RMB 81M to RMB 60M.
Why it's High Risk:
Counter-Intuitive Trend: With sales plummeting, it is highly probable that the credit quality of the company's customers is deteriorating. In such a scenario, the allowance for bad debts should increase, not decrease. By reducing the ECL provision, the company directly reduces its expenses and, therefore, makes its Net Income look better (or its Net Loss look smaller) than it actually is.
Subjectivity: The ECL calculation is heavily based on management's forward-looking estimates. It is easy to manipulate by using more optimistic assumptions about customer payments.
Conclusion: Reducing this allowance while the business is in a steep decline is a classic red flag for earnings management. The company is likely under-provisioning for bad debts to artificially inflate its earnings.
Other High-Risk Items
1. Adjustment on additional quarry cost
What it is: This DTA appeared in 2021 and is a significant amount. Its nature as an "adjustment" suggests it is not a standard, recurring item and likely involves significant estimation.
Why it's High Risk:
Timing and Materiality: It was introduced with a large value (RMB 60.7M) in 2021, just as the company's profitability began its steep decline. Creating a large DTA helps to offset other negative impacts on the balance sheet and earnings.
Lack of Clarity: The term "additional quarry cost" is vague. Without more information, it is difficult to verify the legitimacy or the accounting treatment of this cost. This ambiguity makes it susceptible to manipulation.
2. Impairment of property, plant and equipment (PPE)
What it is: This is a new, one-off DTA of RMB 22M in 2024. An impairment charge is taken to reduce the book value of an asset when its fair value is lower. This charge is an expense that reduces net income. The DTA is created because this accounting loss may be tax-deductible in the future.
Why it's High Risk:
"Big Bath" Accounting: The risk here is less about inflating current-year earnings (since an impairment reduces them) and more about timing. Management might be taking an excessively large, one-time write-down in a year that is already bad (a "big bath"). This gets all the bad news out of the way and sets a lower base for assets, making future years' performance (like return on assets) look much better in comparison.
Lower Risk Items
Undistributed earnings of PRC subsidiaries (DTL): This Deferred Tax Liability has exploded from RMB 77.5M in 2023 to RMB 212.9M in 2024. While the volatility and reliance on management's intentions for repatriation carry risk, recognizing a DTL has a negative impact on the balance sheet. It's therefore an unlikely tool for inflating earnings. The dramatic increase may suggest the company is now forced to repatriate cash due to poor domestic performance. In the annual report, this huge increase in this DTL section was due to “effect of change in tax rate”.
Fair value adjustment on assets acquired (DTL): This is a standard accounting entry related to an acquisition. Its steady decline is consistent with the amortization of the acquired assets over time. This is mechanical and low risk.
Right-of-use assets & Lease liabilities: These are offsetting entries as required by modern lease accounting standards (IFRS 16/ASC 842). They have no net impact and are extremely low risk for manipulation.
Conclusion
The Allowance of ECL of trade and other receivables has the highest and most direct risk of being used for earnings manipulation. Its decreasing trend in the face of a collapsing business is a significant anomaly that points to a potential understatement of expenses to artificially improve reported net income. The Adjustment on additional quarry cost and the Impairment of PPE are also high-risk due to their subjective nature and suspicious timing.
(4) Company characteristics
1. Business Moat / Strengths
Financial Prudence and a Strong Balance Sheet: This is the company's most significant strength. The Group maintains a strong balance sheet with substantial cash reserves and a low gearing ratio (total liabilities to total assets) , which decreased from 24% in 2020 to 14% in 2024. This financial conservatism provides crucial "staying power" in a protracted industry downturn.
Proactive Investment in Green and Digital Transformation: The company has made sustained investments in green transformation and digitalization, which are seen as a long-term competitive advantage. By focusing on achieving "ultra-low emission" standards and developing AI-driven smart factories, the company may gain an edge through lower compliance costs and the ability to operate when less advanced competitors are forced to exit the market.
Logistical and Geographic Advantages: The company has a strategic focus on its core markets along the Yangtze River. It has invested in expanding its port facilities and introducing new conveyor belt transport systems to create regional strongholds with enhanced logistical efficiencies and lower transportation costs.
Strategic Diversification Efforts: Recognizing pressure in the traditional cement market, the company is actively expanding into aggregate projects to create new revenue streams. This is demonstrated by significant capacity increases in Jiangxi and Huanggang in 2023 and 2024.
2. Business Weaknesses
Vulnerability to Macroeconomic Shocks: The business is extremely vulnerable to shifts in government policy and economic cycles. Its performance is heavily reliant on the construction sector, particularly the real estate market, which has experienced a severe downturn, sharply reducing cement demand.
"Commodity Trap" and Lack of Pricing Power: The cement industry is fundamentally a commoditized business, making participants highly susceptible to price wars ("involution") during periods of oversupply. Asia Cement (China) has often acted as a price taker rather than a price setter, as evidenced by the fact that product price reductions outpaced cost savings in 2024.
High Operating Leverage and Profit Volatility: The business model has high operating leverage due to its capital-intensive nature. This means that relatively small changes in revenue can have a magnified, and often negative, impact on profitability. For instance, in 2022, an 18.2% revenue decline resulted in a disproportionately larger 76.7% plunge in net profit.
Inaccurate Management Forecasting and Communication: There is a recurring pattern of management issuing optimistic outlooks regarding market recovery and profitability that subsequently do not align with actual results. This gap between forecasts and reality could impact long-term investor credibility.
Chronic Industry Overcapacity: The company operates within a Chinese cement industry that suffers from a chronic structural problem of overcapacity. This fundamental supply-demand imbalance fuels intense price competition and makes sustained profitability difficult to achieve.
Related party disclosure

1. (Highest Risk) Transportation Expenses Paid to Joint Ventures
This transaction represents the most significant and persistent risk of a "fishy" or non-arm's-length arrangement.
Trend Analysis: While the absolute expense has decreased from RMB 152M in 2019 to RMB 102M in 2024, this decline is slower than the decline in overall business activity.
Why it's the Highest Risk: The critical issue here is concentration. Let's analyse this expense as a percentage of the company's total "Distribution and selling expenses":
2024: 102,736 / 348,967 = 29.4%
2023: 125,871 / 447,257 = 28.1%
2022: 98,743 / 437,244 = 22.6%
2019: 152,121 / 447,454 = 34.0%
The company consistently relies on its joint ventures for approximately 30% of its entire transportation and distribution costs. This is an extremely high level of dependence.
Manipulation Potential:
Siphoning Profits: The company could be intentionally overpaying its joint ventures for these services. This would effectively shift cash and profits from the main company to the JV, benefiting the owners of the JV at the expense of the company's other shareholders.
Lack of Competitive Pricing: With such a high concentration, it is unlikely the company is seeking competitive bids for these critical services, meaning it is probably not securing the best market price. The arrangement may exist to benefit the related party rather than for sound commercial reasons.
2. (High Risk) Sales of Goods to Joint Ventures
This is a different type of risk, one that points directly to potential earnings manipulation in the most recent period.
Trend Analysis: This transaction is new. There were no sales to joint ventures from 2019 to 2023. Suddenly, in 2024—the company's worst-performing year on record—there is a sale of RMB 18.87 million.
Why it's High Risk:
Suspicious Timing: The appearance of a new revenue stream from a related party precisely when the company is reporting massive losses and a collapse in sales is a major red flag.
Earnings Manipulation Potential: This transaction has the hallmarks of an attempt to fabricate revenue or "stuff the channel". The company may have arranged for the JV to "buy" goods it didn't need simply to allow the company to book revenue and slightly reduce its catastrophic sales decline. The commercial substance of this sale is highly questionable. While RMB 18.87M is small compared to total sales of RMB 5.8B, it demonstrates a potential willingness by management to use related parties to manipulate financial results.
(5) Valuation
The investment thesis for Asia Cement is a deep value opportunity based on a potential cyclical turnaround. The company is not a stable, high-quality compounder but rather a highly cyclical business currently trading at a deeply depressed valuation that reflects significant market pessimism.
The core thesis rests on the company's substantial asset base—evidenced by a positive and growing Net-net Current Asset (NNCA) value and stable book value—providing the "staying power" to survive the current industry downturn. The investment is a calculated position on the eventual normalization of the business cycle, which could lead to a significant re-rating of the stock.
Valuation Analysis: Discount to Historical Norms
Given the inconsistent earnings and potential accounting red flags, forecasting future performance is fraught with uncertainty. A more reliable valuation approach is to assess the current market capitalization against normalized historical performance.
Current Market Capitalization: RMB 3,680 million
Scenario 1: Base Case (2011-2024 Historical Average) This scenario assumes that over the long term, the company's performance will revert to its 14-year historical mean.
Average Sales (2011-2024): RMB 8,600 million
Average Net Margin: 10%
Normalized Net Income: RMB 860 million
Implied Valuation (at a 10% capitalization rate): RMB 8,600 million
Potential Upside: +134%
Scenario 2: Conservative Case (Pre-Mania Period, 2011-2017) This scenario uses a more conservative period before the 2018-2019 cyclical peak to establish a baseline.
Average Sales (2011-2017): RMB 7,280 million
Average Net Margin: 7%
Normalized Net Income: RMB 510 million
Implied Valuation (at a 10% capitalization rate): RMB 5,100 million
Potential Upside: +39%
Stress Test: Under the conservative sales scenario (RMB 7,280M), a depressed net margin of just 5% would imply a valuation of RMB 3,640M (with 10% capitalization rate), which is approximately the current market capitalization. This suggests that the current stock price has priced in a scenario of prolonged, historically low profitability.
Key Observations & Risk Assessment
Strengths & Balance Sheet Resilience
Strong Asset Base (NNCA): Net-net Current Assets turned positive in 2018 and have improved since, reaching a recent multi-year high. This provides a tangible buffer of liquid assets over total liabilities. The market cap-to-NNCA ratio is at its lowest point since 2018, highlighting the extreme pessimism.
Stable Book Value: Despite operational volatility, Book Value Per Share (BVPS) has remained consistent from 2020 to 2024, indicating the preservation of underlying equity.
Sufficient Operating Cash Flow: The business generates enough cash from operations to cover its capital expenditures, resulting in positive free cash flow.
No Shareholder Dilution: The share count has remained stable, protecting equity value for existing shareholders.
Weaknesses & Significant Risks
Deteriorating Performance: Revenue and profit margins have been in a clear downtrend since the 2020 peak, culminating in recent net losses.
High Financial Leverage: The company is highly leveraged. The annual amount of debt issued and repaid is 2-3 times its cash from operations, signaling a heavy reliance on refinancing to maintain liquidity. This poses a significant risk in a tight credit market.
Potential Earnings Management: Previous analysis has raised concerns regarding the management of other income, deferred tax assets, and the nature of certain related-party transactions, suggesting that reported earnings may not fully reflect the company's underlying economic reality.
PEERS’ comparisons


Similar Trends Across All Companies
Across all five cement producers, several powerful and consistent trends are evident, painting a clear picture of the industry's state:
Collapsing Profitability: This is the most dominant trend. Every company experienced peak profitability around FY2019-FY2020, followed by a relentless decline in gross, EBIT, and net income margins. This points to a systemic issue of lower prices and demand impacting the entire sector.
Shrinking Revenue and Income: Apart from some volatility, the general trend for total revenue and, more dramatically, net income is downwards. The decline accelerated significantly from FY2022 onwards.
Deteriorating Returns: Both Return on Assets (ROA) and Return on Equity (ROE) have fallen sharply for every company, moving from healthy double-digit returns in 2019 to low single-digit or even negative returns in the LTM period. This shows that capital is being employed much less effectively than before.
Plummeting Market Valuations: Investors have recognized the industry's challenges. The market capitalization for all five companies has been slashed, often by more than 50-70% from their 2019 peaks. Valuation metrics like Price to Book value are now at distressed levels (0.20 to 0.58), indicating severe market pessimism.
Reduced Dividend Payouts: Reflecting the fall in income and cash flow, total dividends paid have been significantly reduced across the board, as companies move to conserve cash.
In conclusion, the data reveals a synchronized downturn for these major Chinese cement companies. The period from 2019 to the present has been one of stark reversal, moving from peak conditions to a deep cyclical trough driven by macroeconomic headwinds, primarily the crisis in China's property market.
Why has the market applied such a steep discount to Asia Cement (lowest PB ratio)?
1. The Velocity of Operational Decline: While all companies are suffering, Asia Cement's operational performance has fallen off a cliff more dramatically than its peers.
Profitability Collapse: Its net income margin has plummeted from a stellar 25% in FY2019 to -4% in FY2024. This isn't just a decline; it's a swing into unprofitability.
Vanishing Free Cash Flow (FCF): FCF has evaporated, dropping from a massive RMB 4.6bn in FY2019 to a negligible RMB 2m in FY2024. A strong balance sheet is a static snapshot; FCF is the dynamic lifeblood of a company. A company that isn't generating cash cannot sustain itself forever, no matter how strong its starting position.
Let's contrast this with Anhui Conch. While its ROA is also low at 2%, its LTM Net Income Margin is a resilient 9%, and it generated a formidable RMB 8.1bn in Free Cash Flow.
2. The Double-Edged Sword of Deep Value: The market is not irrational for pricing Asia Cement so low. The extreme discount is the market's way of saying it has very little confidence in the company's future earning power. The key question the data poses is: Is Asia Cement a strong company facing temporary headwinds, or is it a deteriorating business whose balance sheet strength is being steadily eroded by operational losses?
The current negative ROE (-1%) and negative net income suggest that shareholder value is actively being destroyed at an operational level. The strong balance sheet gives it time, but it doesn't solve the underlying problem of unprofitability.
3. The Question of Scale in a Downturn: Asia Cement is a much smaller player compared to giants like Anhui Conch and CNBM. In a severe industry downturn, which the data clearly shows, larger companies often have more leverage. They can command better terms from suppliers, have greater influence on regional pricing, and are more likely to be the consolidators that acquire weaker players. Asia Cement's fortress balance sheet makes it a survivor, but its smaller scale could put it at a competitive disadvantage in a "lower-for-longer" price environment.
Conclusion: A Tale of Two Strategies
Is Asia Cement better positioned to withstand the downturn? Yes, from a pure survival perspective, its balance sheet is arguably the strongest safety net.
However, some might point to insightful question which company is better positioned to thrive during and after the downturn. Asia Cement is a bet on survival and recovery, buying assets at a steep discount and betting that management can eventually restore profitability before the cash pile is depleted.
An alternative thesis, using the same data, would be to favour Anhui Conch. This is a bet on resilience and quality. You pay a higher valuation (P/B of 0.50, Mkt Cap/NNCA of 2.95), but you are buying a market leader that has proven it can maintain significant profitability and generate massive free cash flow even at the bottom of the cycle.
Ultimately, preference for Asia Cement is a perfectly logical deep-value strategy. The critical risk, clearly visible in the data, is that the operational business continues to decline, slowly consuming the very "margin of safety" that makes it so attractive today.
Conclusion
Asia Cement presents a classic deep value profile. The market is penalizing the company for its cyclical downturn, high leverage, and some minor questionable accounting, causing it to trade at a substantial discount to its historical earning power and asset base.
The investment hinges on a single premise: survival. If the company's asset backing is sufficient to weather the current industry trough, a reversion to even conservative historical margins and sales levels offers substantial upside. This is an investment in a potential turnaround, not in current business quality.